Learn to find and resolve the bugs in your code with the powerful debugging tools in Visual Studio 2015. Walt Ritscher first introduces the philosophy behind debugging, including common debug scenarios and defect categories, and then shows how to put Visual Studio’s debugging tools to work on your code. Learn how to step through code, work with exceptions, dive deeper into variables with DataTips and visualizers, and use Watch, Intermediate, and Diagnostics windows to evaluate code and the performance of your application. The course closes with a chapter where Walt puts the tools together to debug different types of applications, including console, desktop, web, and mobile apps.
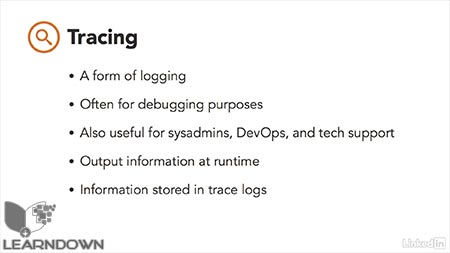
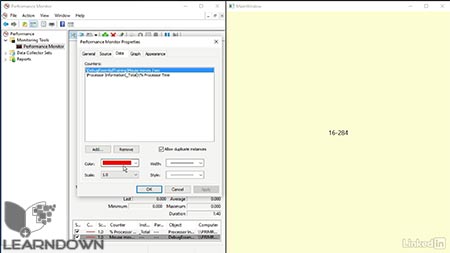
Topics include Debug and Troubleshoot Code:
- Understanding the debugging vocabulary
- Understanding the defect categories
- Stepping through code
- Working with DataTips and visualizers
- Traversing the call stack
- Attaching debuggers to running processes
- Using the Just-in-Time debugger
- Debugging applications, including JavaScript and mobile apps






Leave a Reply